
GRIDview Product User Manual
Introduction
Welcome to the GRIDview Product User Manual, your comprehensive guide to maximizing the potential of GRIDview Cloud, an advanced cloud-based energy management platform. Specifically designed to complement GRIDlink OpenADR Virtual End Nodes (VENs) and Smart Controllers, GRIDview offers robust tools for real-time monitoring, efficient management, and seamless optimization of distributed energy resources (DERs).
GRIDview Cloud empowers utilities, energy managers, and facility operators with centralized control over demand response (DR) events, grid-interactive systems, and energy resource performance. This platform simplifies complex energy management tasks, improves operational transparency, and ensures compliance with OpenADR standards, making it a trusted solution for modern energy management.
Whether you’re managing large-scale energy programs or fine-tuning facility operations, GRIDview Cloud equips you with the insights and tools to achieve your energy goals effectively. Dive into this manual to unlock the full potential of GRIDview.
GRIDview Account Signup
North American Operations

Whitelist GRIDview
1.00 GRIDview UI Dashboard
1.10 Description
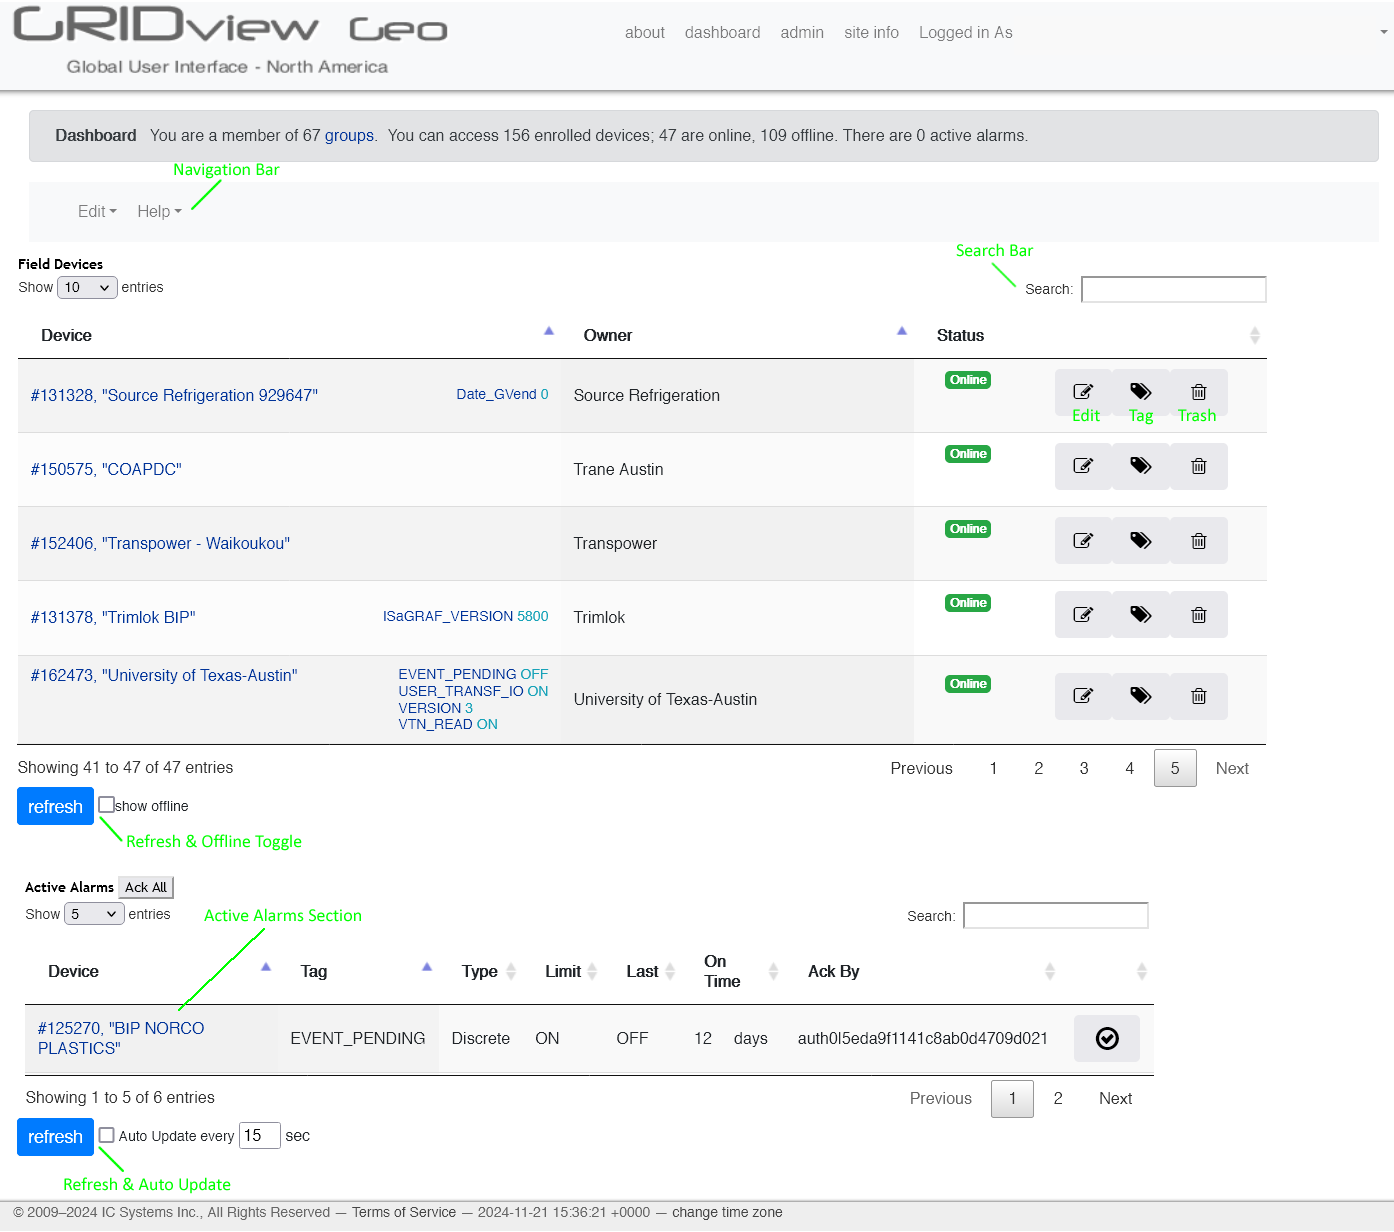
The GRIDview Dashboard provides a centralized, user-friendly interface to manage all Field Devices (GRIDlink VENs) associated with your account. Designed for efficiency and accessibility, the dashboard equips users with tools to monitor, control, and maintain their devices seamlessly.
1.20 Features
1.21 Field Device Overview
Device List: Displays all GRIDlink VENs assigned to your account, including essential details such as:
-
-
-
- Serial Number
- Device Name
- Owner
- Current Status (Online/Offline
-
-
1.23 Search Functionality
-
-
- Search Bar: Quickly locate a specific device by name, serial number, or other identifiers.
-
1.24 Device Interaction Options
-
-
- Edit Icon:
- Select individual devices to view or interact with the available GRIDview functions.
- Tag Icon:
- View detailed tags containing device-specific data.
- Trash Can Icon:
- Delete devices no longer required in your account.
- Edit Icon:
-
1.25 Refresh and Offline Toggle
-
-
- Refresh Button:
- Refresh the list to ensure the latest device information is displayed.
- Show Offline Checkbox:
- Toggle between showing only online devices or the complete device list (including offline devices).
- Refresh Button:
-
1.30 Active Alarms Section
At the bottom of the dashboard, the Active Alarms section displays:
1.31 Alarm Details by Device:
-
-
-
- Serial Number
- Description
- Alarm Tag, Type, and Limit
- Timestamp of the Last Event
- On Time Duration
- Acknowledge Status and Button
-
-
1.40 Auto Update
1.41 Refresh Button:
-
-
- Manually refresh the alarms list for the most up-to-date information.
-
1.42 Auto Update Checkbox:
-
-
- Enable automatic data updates at a customizable time interval.
-
2.00 Device Status Overview
From the Dashboard select the Device you wish to monitor and click the edit icon.
2.10 Navigation Bar
-
-
- Top:
- Return to Dashboard
- View:
- Tags & Alarms
- History
- Alarm Events
- Offline Events
- Status
- Data Summary
- Log
- Page
- Device
- Tags
- Alarms
- Settings
- Templates
- Files
- Commands
- Help
- overview
- custom templates
- Top:
-
